Diffusion of Innovation Theory
It takes time for good technology to gain popularity. From the chart below, we can see that, even for the Internet, it still takes 17 years for 50% of US households to adopt it, no matter how profoundly it has changed our lives today.
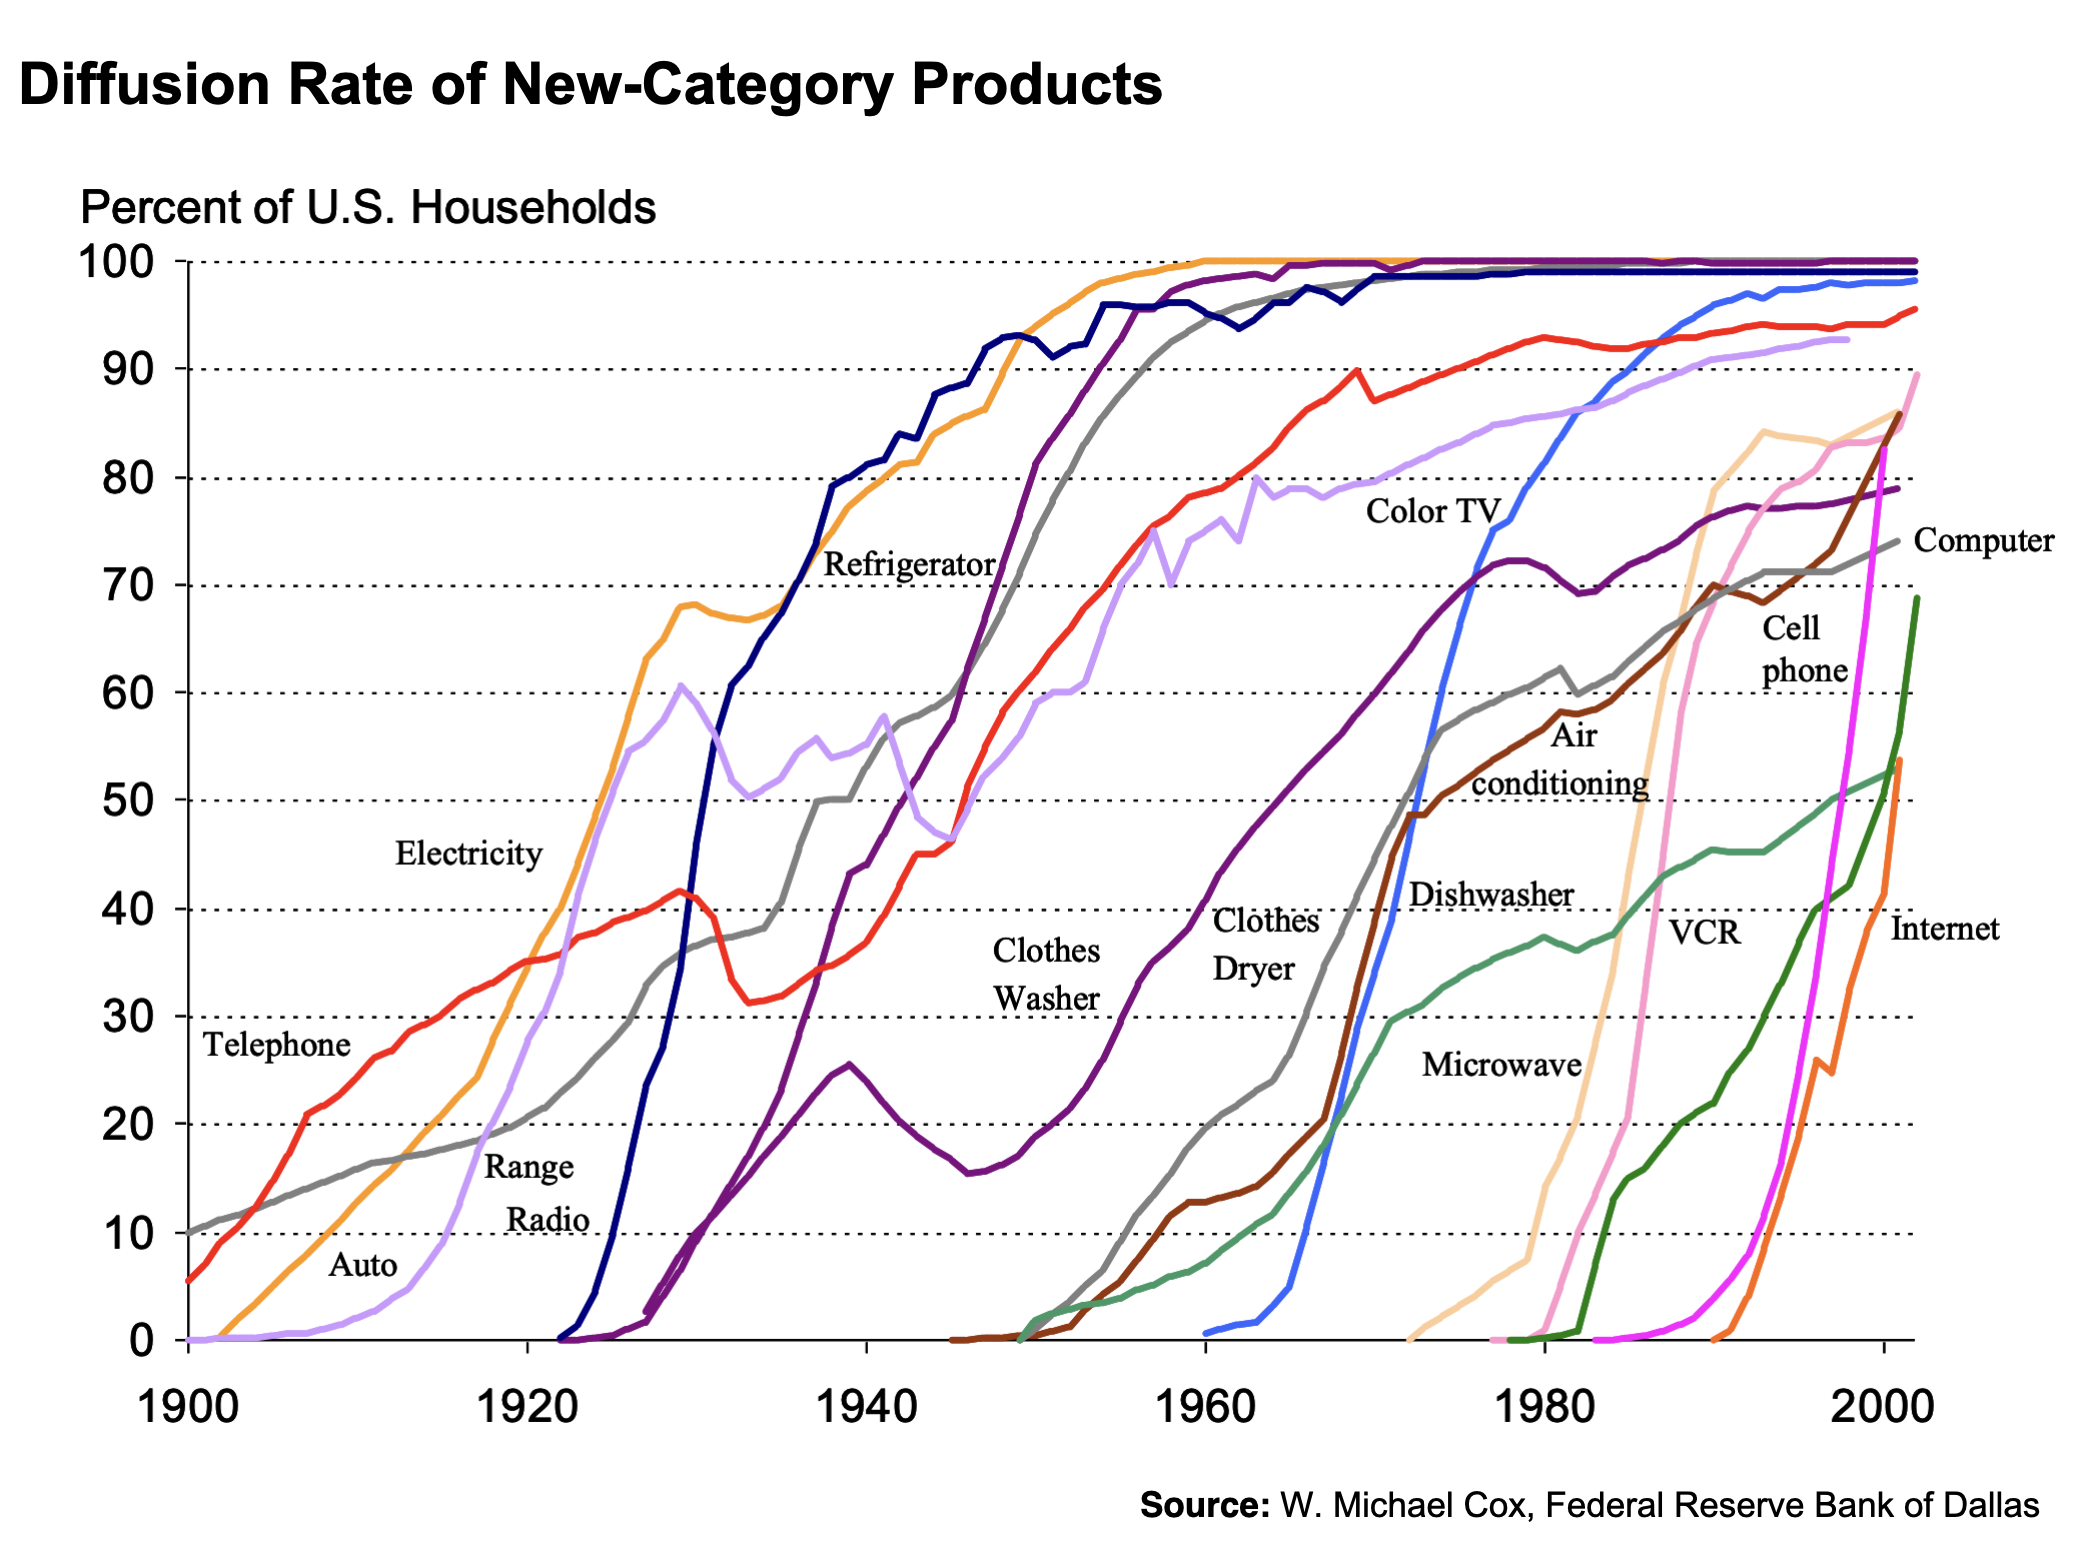
That’s why I am always respectful towards all kinds of innovations - no matter how small it appears today, who would imagine it will take over the world tens of years later?
As a builder or businessman, we have a product or service to sell, and the question is - how to speed up the process for it to take over the market?
The Model
Everett M. Rogers came up with Five Intrinsic Attributes of Innovation in his Diffusion of Innovation Theory :
- Relative advantage: how much is the product perceived as better than the existing standard? We often ask, is this product 10x better than the existing one?
- Compatibility: how easily can I apply my experience to the new product? Customers hate changes even with new versions of an existing product, not even mention utterly new products with entirely new features.
- Complexity: Is it easy to use?
- Trialability: Is it easy to try?
- Observability: Is it obvious for people to observe the change?
The Chasm
In addition to the intrinsic attributes above, there are interactions between the innovation and the market segments. We call it the technology adoption lifecycle (TAL), which categorizes customers on the market into five pieces.
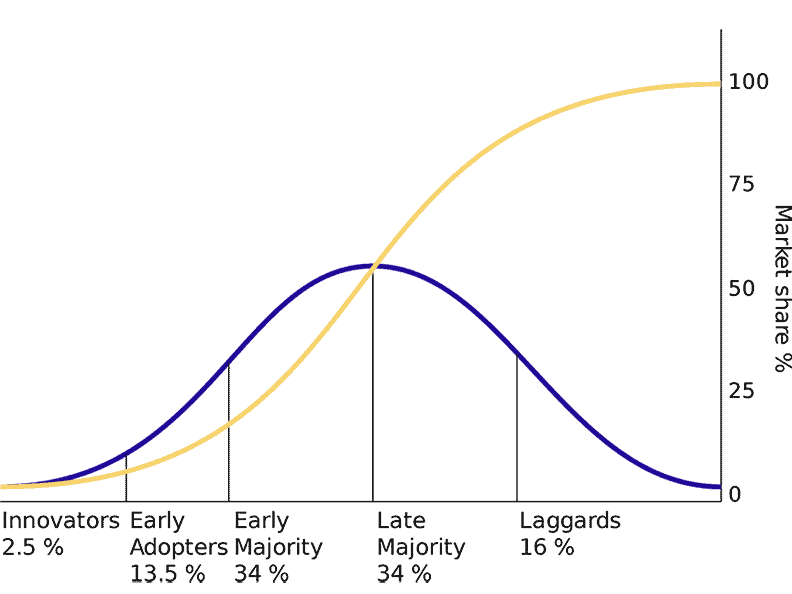
The Chasm theory indicates that there is no smooth transition from early adopters to the early majority because those two market segments want different value propositions. Crossing the Chasm applies the “D-Day analogy” to solve the problem - focus, focus, focus! Focus is all it takes to attack each segment one by one - like D-Day - you take over the beach first and then move to the next target.
The Math
Every entrepreneur would dream of a beautiful S-curve for their innovation to diffuse into the market. So to unveil the math curtain, let’s see how Scott Page explains it in the book model thinker, Chapter 11: Broadcast, Diffusion, and Contagion.
The abstraction here is to partition the population into two groups:
- informed: people who know or have something and
- susceptible: those who do not.
Group informed starts empty, and group susceptible is all the relevant population exposed to conversion. The growth curves are in various shapes with various models to convert people from susceptible to informed.
r-shape for broadcast model
This model assumes that
- people capture info from public channels, and there is no word-of-mouth / mutual reference between individuals
- once converted, there is no moving-back
And then we get this formula
- : the broadcast probability
- : the number informed at time
- : the number susceptible at time
- Initially, and
- : relevant population
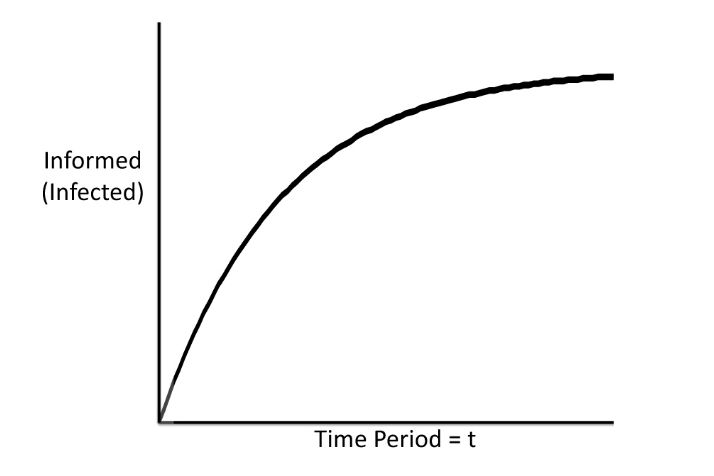
We could learn from the model that...
- In this broadcast model, all susceptible will be eventually converted to informed, and it is just a matter of time how soon it will complete.
- To maximize informed, we should maximize susceptible first. It means that our ads should reach as many potential customers as we can.
- To speed up the conversion, we should make our ads as high-frequent and impressive as possible.
- With the formula above, we could make a rough prediction for future sales with the ones in the previous two periods.
s-shape for diffusion model
This model assumes that
- people capture info by mutual reference and there is no public channel
- once converted, there is no moving-back
- people are randomly mixed
And then we get this formula
- where
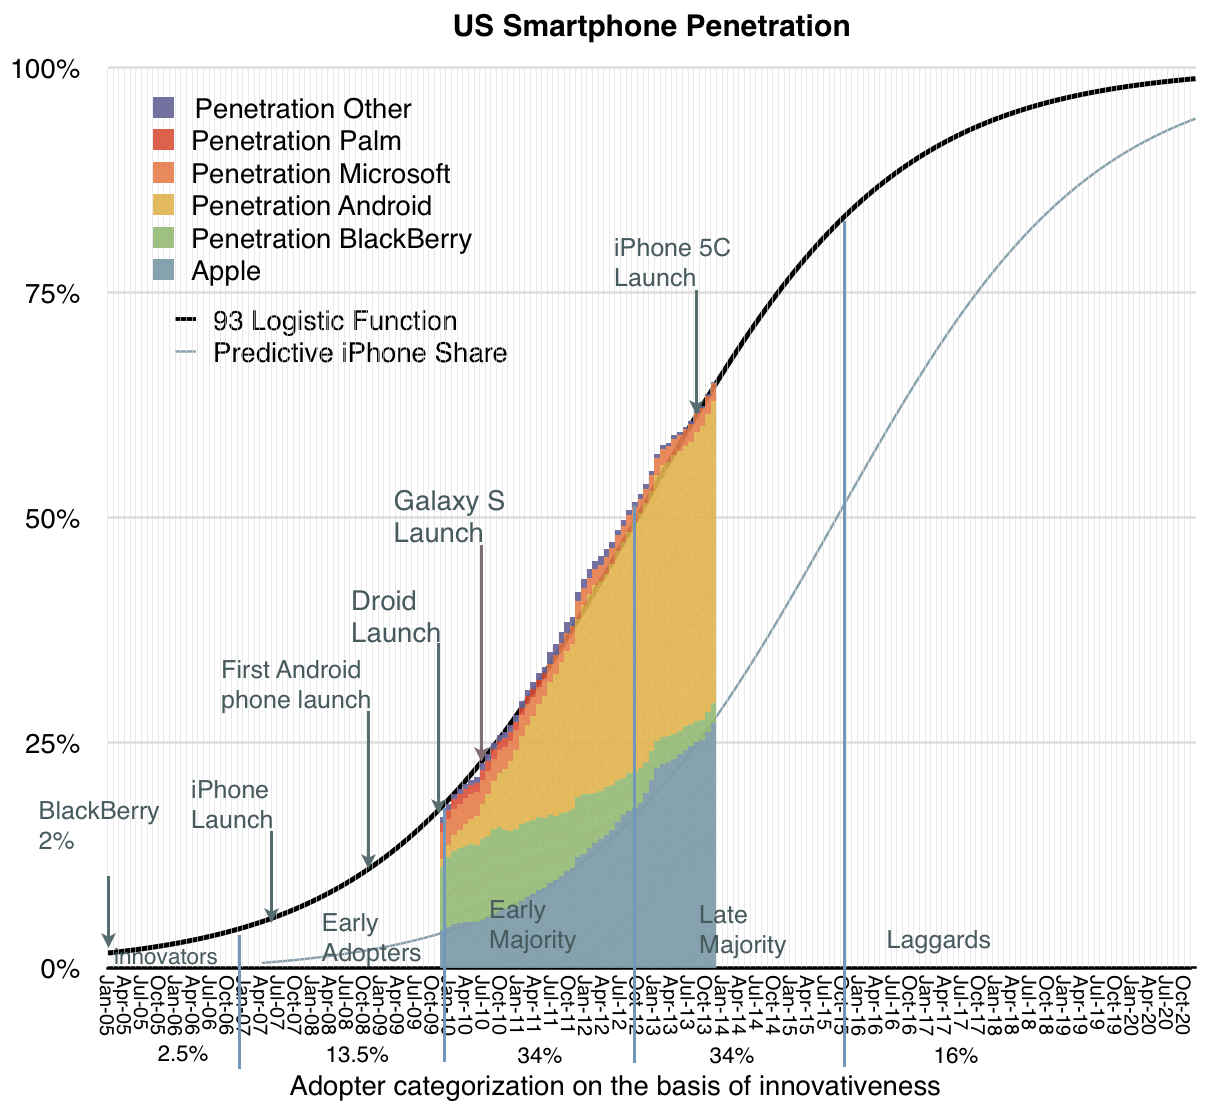
We could learn from the model that...
- How fast the conversion happens is determined by how frequently those people contact each other and how much they would like to share the info.
mixing of r-and-s-shape for Bass model
Most consumer goods and info spread through both broadcast and diffusion. Usually, for the same product, companies are running ad campaigns; meanwhile, customers are referring new customers.
susceptible-infected-recovered (SIR) model
All the models above assume no moving back from informed to susceptible. We seldomly abandon our adoption of many home appliances - dishwashers, air dryers, etc. However, it is not the same for fashion styles, diseases, and ... your brand in the real world. In this case, things are contagious only for a particular time. People may forget your product as time passes by and then get recovered.
Let's introduce the probability of recovery, then we get the susceptible-infected-recovered (SIR) model.
For disease control, the infected will rise first, and we hope it will eventually drop.
However, we hope the informed will rise to the top for our products. The SIR model produces a ==tipping point==, aka, ==basic reproduction number ()==.
Products with spread through the population, while products with dissipate.
Take COVID as an example. Its is 2 to 3. and that is why people wear masks, keep distances from others and avoid crowds to lower the diffuse probabilities.
is the ultimate question for marketing - would your marketing be contagious enough to fight against forgetfulness?
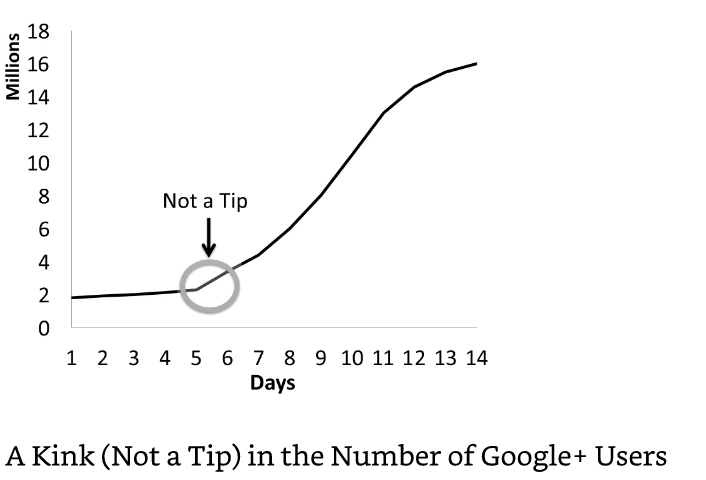
By the formal definition, the mass media version of the tipping point is usually wrong. For example, a kink is not a tipping point in the chart below for the number of Google Plus users in the first 14 days. Instead, is the real tipping point.
Elements of GTM - Reach, Frequency, and Quality
Finally, here is the summarization of all components that are worth optimizing for go-to-market campaigns. Please note that spreading information carries costs, unlike diseases, so we need to consider ROI.
- Reach channels
- Customer Segment Size: Make sure your ads are going to the susceptible targets, as many of them as possible.
- Customer Segment Attributes: The more each person in the segment is likely to contact and share the info, the more contagious the group is. It would help if you prefer people with a strong frequency and willingness to share information. (Attacking visionaries first!)
- How-to
- Frequency: Make sure people cannot ignore your message by conveying it multiple times.
- Quality Conversion Rate: Make the ads likable and memorable. It's usually something they are familiar with but still a surprise.
- Make it big and fast. Don't forget that people will forget! Ideally, make diffusion rate > recovering rate.
- ROI. Don't spend too less or too much on customer acquisition (LTV:CAC = 3:1).