Requirement Analysis
If you ask what the biggest difference is between Silicon Valley companies and those in China, the answer is likely as Wu Jun said: Silicon Valley companies primarily target the global market. As Chen Zhiwu aptly stated, the ability to create wealth can be measured by three dimensions: depth, which refers to productivity—the ability to provide better products or services in the same amount of time; length, which refers to the ability to leverage finance to exchange value across time and space; and breadth, which refers to market size—the ability to create markets or new industries that transcend geographical boundaries. Internationalization, which is the localization of products and services in terms of language and culture, is indeed a strategic key for multinational companies competing in the global market.
Internationalization, abbreviated as i18n (with 18 letters between the 'i' and the 'n'), aims to solve the following issues in the development of websites and mobile apps:
- Language
- Time and Time Zones
- Numbers and Currency
Framework Design
Language
Logic and Details
The essence of language is as a medium for delivering messages to the audience; different languages serve as different media, each targeting different audiences. For example, if we want to display the message to the user: "Hello, Xiaoli!", the process involves checking the language table, determining the user's language, and the current required interpolation, such as the name, to display the corresponding message:
| Message Codes | Locales | Translations |
|---|
| home.hello | en | Hello, ${username}! |
| home.hello | zh-CN | 你好, ${username}! |
| home.hello | IW | !${username}, שלום |
| … | … | … |
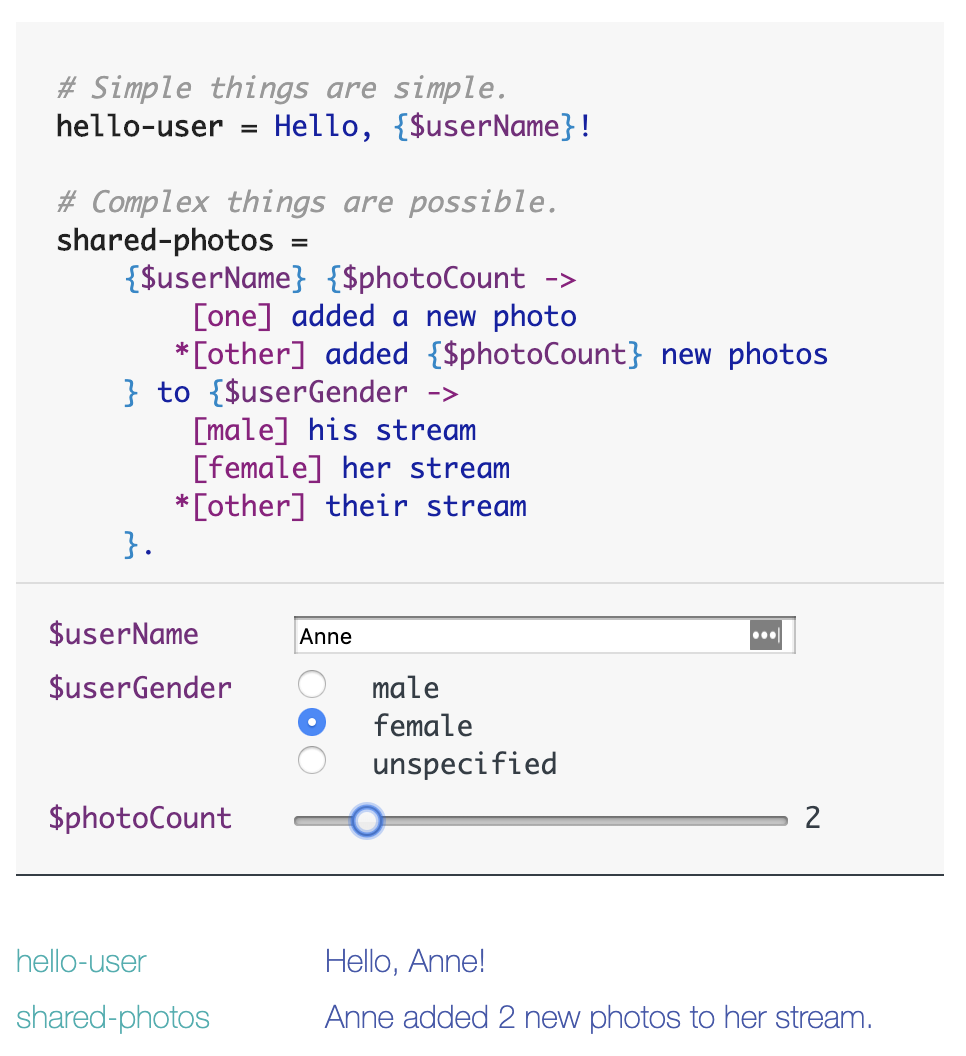
Different languages may have slight variations in details, such as the singular and plural forms of an item, or the distinction between male and female in third-person references.
These are issues that simple table lookups cannot handle, requiring more complex logic processing. In code, you can use conditional statements to handle these exceptions. Additionally, some internationalization frameworks invent Domain-Specific Languages (DSL) to specifically address these situations. For example, The Project Fluent:
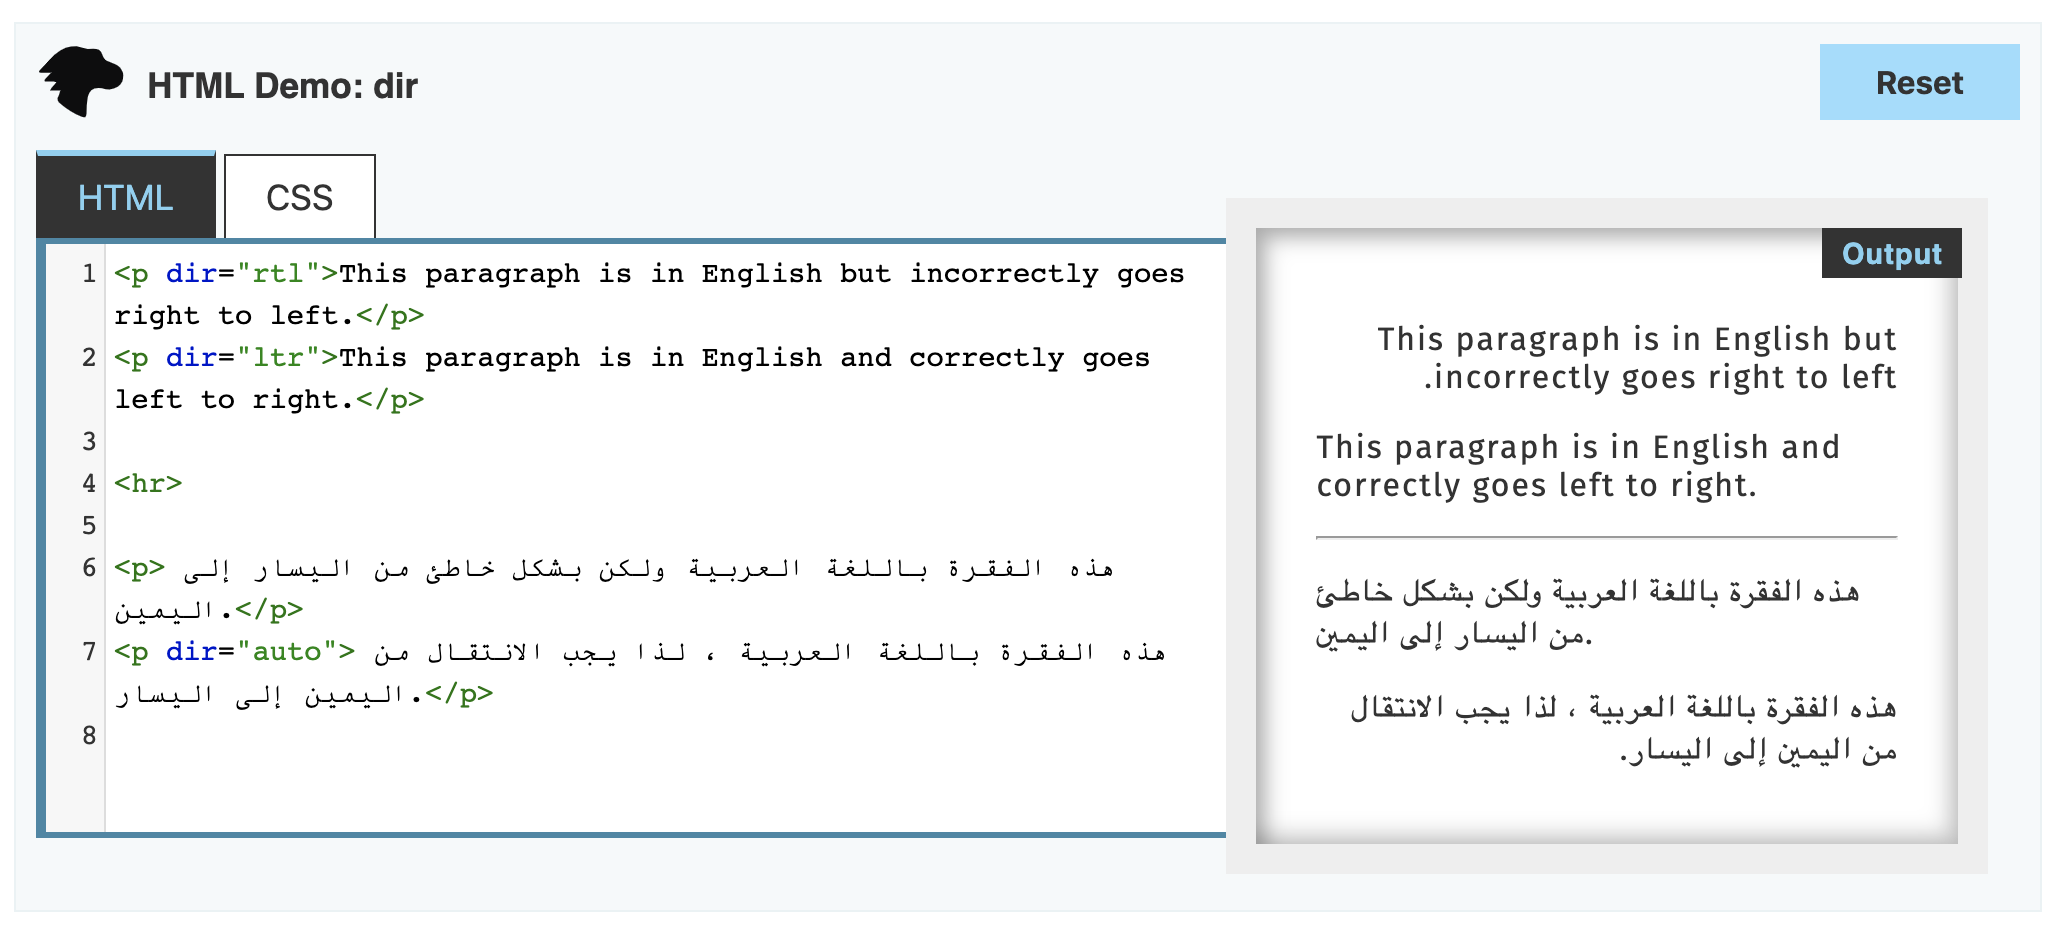
Another issue that beginners often overlook is the direction of writing. Common languages like Chinese and English are written from left to right, while some languages, such as Hebrew and Arabic, are written from right to left.
The difference in writing direction affects not only the text itself but also the input method. A Chinese person would find it very strange to input text from right to left; conversely, a Jewish colleague of mine finds it easy to mix English and Hebrew input.
Layout is another consideration. The entire UI layout and visual elements, such as the direction of arrows, may change based on the language's direction. Your HTML needs to set the appropriate dir attribute.
How to Determine the User's Locale?
You may wonder how we know the user's current language settings. In the case of a browser, when a user requests a webpage, there is a header called Accept-Language that indicates the accepted languages. These settings come from the user's system language and browser settings. In mobile apps, there is usually an API to retrieve the locale variable or constant. Another method is to determine the user's location based on their IP or GPS information and then display the corresponding language. For multinational companies, users often indicate their language preferences and geographical regions during registration.
If a user wants to change the language, websites have various approaches, while mobile apps tend to have more fixed APIs. Here are some methods for websites:
- Set a locale cookie
- Use different subdomains
- Use a dedicated domain. Pinterest has an article discussing how they utilize localized domains. Research shows that using local domain suffixes leads to higher click-through rates.
- Use different paths
- Use query parameters. While this method is feasible, it is not SEO-friendly.
Beginners often forget to mark the lang attribute in HTML when creating websites.
Translation Management Systems
Once you have carefully implemented the display of text languages, you will find that establishing and managing a translation library is also a cumbersome process.
Typically, developers do not have expertise in multiple languages. At this point, external translators or pre-existing translation libraries need to be introduced. The challenge here is that translators are often not technical personnel. Allowing them to directly modify code or communicate directly with developers can significantly increase translation costs. Therefore, in Silicon Valley companies, translation management systems (TMS) designed for translators are often managed by a dedicated team or involve purchasing existing solutions, such as the closed-source paid service lokalise.co or the open-source Mozilla Pontoon. A TMS can uniformly manage translation libraries, projects, reviews, and task assignments.
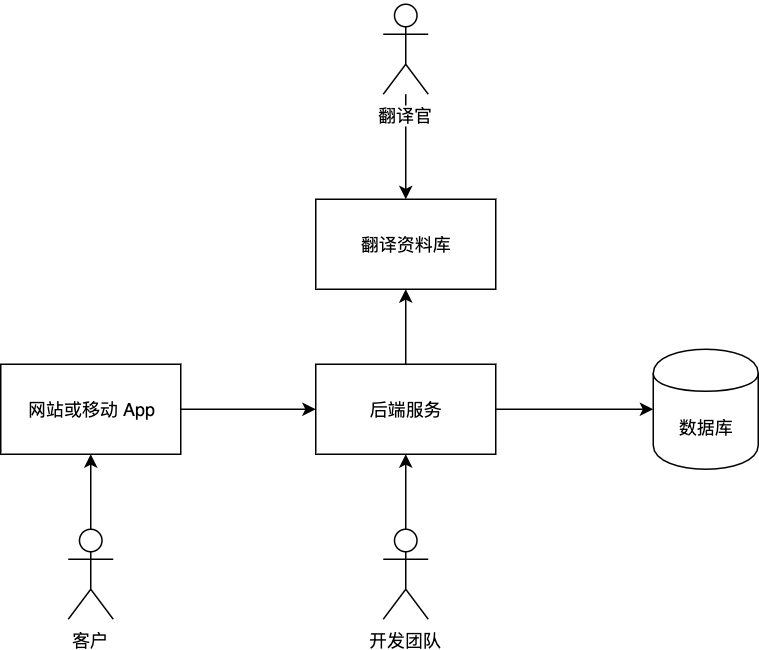
This way, the development process becomes: first, designers identify areas that need attention based on different languages and cultural habits during the design phase. For example, a button that is short in English may be very long in Russian, so care must be taken to avoid overflow. Then, the development team implements specific code logic based on the design requirements and provides message codes, contextual background, and examples written in a language familiar to developers in the translation management system. Subsequently, the translation team fills in translations for various languages in the management system. Finally, the development team pulls the translation library back into the codebase and releases it into the product.
Contextual background is an easily overlooked and challenging aspect. Where in the UI is the message that needs translation? What is its purpose? If the message is too short, further explanation may be needed. With this background knowledge, translators can provide more accurate translations in other languages. If translators cannot fully understand the intended message, they need a feedback channel to reach out to product designers and developers for clarification.
Given the multitude of languages and texts, it is rare for a single translator to handle everything; it typically requires a team of individuals with language expertise from various countries to contribute to the translation library. The entire process is time-consuming and labor-intensive, which is why translation teams are often established, such as outsourcing to Smartling.
Now that we have the code logic and translation library, the next question is: how do we integrate the content of the translation library into the product?
There are many different implementation methods; the most straightforward is a static approach where, each time an update occurs, a diff is submitted and merged into the code. This way, relevant translation materials are already included in the code during the build process.
Another approach is dynamic integration. On one hand, you can "pull" content from a remote translation library, which may lead to performance issues during high website traffic. However, the advantage is that translations are always up-to-date. On the other hand, for optimization, a "push" method can be employed, where any new changes in the translation library trigger a webhook to push the content to the server.
In my view, maintaining translations is more cumbersome than adding them. I have seen large projects become chaotic because old translations were not promptly removed after updates, leading to an unwieldy translation library. A good tool that ensures data consistency would greatly assist in maintaining clean code.
Alibaba's Kiwi internationalization solution has implemented a linter and VS Code plugin to help you check and extract translations from the code.
Time and Time Zones
Having discussed language, the next topic is time and time zones. As a global company, much of the data comes from around the world and is displayed to users globally. For example, how do international flights ensure that start and end times are consistent globally and displayed appropriately across different time zones? This is crucial. The same situation applies to all time-related events, such as booking hotels, reserving restaurants, and scheduling meetings.
First, there are several typical representations of time:
- Natural language, such as
07:23:01, Monday 28, October 2019 CST AM/PM
- Unix timestamp (Int type), such as
1572218668
- Datetime. Note that when MySQL stores datetime, it converts it to UTC based on the server's time zone and stores it, converting it back when reading. However, the server's time zone is generally set to UTC. In this case, the storage does not include time zone information, defaulting to UTC.
- ISO Date, such as
2019-10-27T23:24:28+00:00, which includes time zone information.
I have no strong preference for these formats; if you have relevant experience, feel free to discuss it.
When displaying time, two types of conversions may occur: one is converting the stored server time zone to the local time zone for display; the other is converting machine code to natural language. A popular approach for the latter is to use powerful libraries for handling time and dates, such as moment.js and dayjs.
Numbers and Currency
The display of numbers varies significantly across different countries and regions. The meaning of commas and periods in numbers differs from one country to another.
(1000.1)
.toLocaleString("en")(
1000.1,
)
.toLocaleString("de")(
1000.1,
)
.toLocaleString("ru");
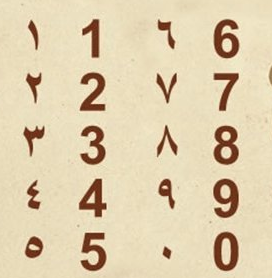
Arabic numerals are not universally applicable; for instance, in Java's String.format, the digits 1, 2, 3 are represented as ١، ٢، ٣ in actual Arabic language.
Regarding pricing, should the same goods be displayed in local currency values in different countries? What is the currency symbol? How precise should the currency be? These questions must be addressed in advance.
Conclusion
The internationalization tools mentioned in this article include translation management systems, the open-source Mozilla Pontoon, the closed-source paid service lokalise.co, POEditor.com, and so on. For code consistency, Alibaba's Kiwi internationalization solution is recommended. For UI display, consider using moment.js and day.js.
Like all software system development, there is no silver bullet for internationalization; great works are crafted through foundational skills honed over time.
.png "Optimism Architecture")